DATA ANALYTICS CONSULTING SERVICES
Helping You Make Sense of Your Data
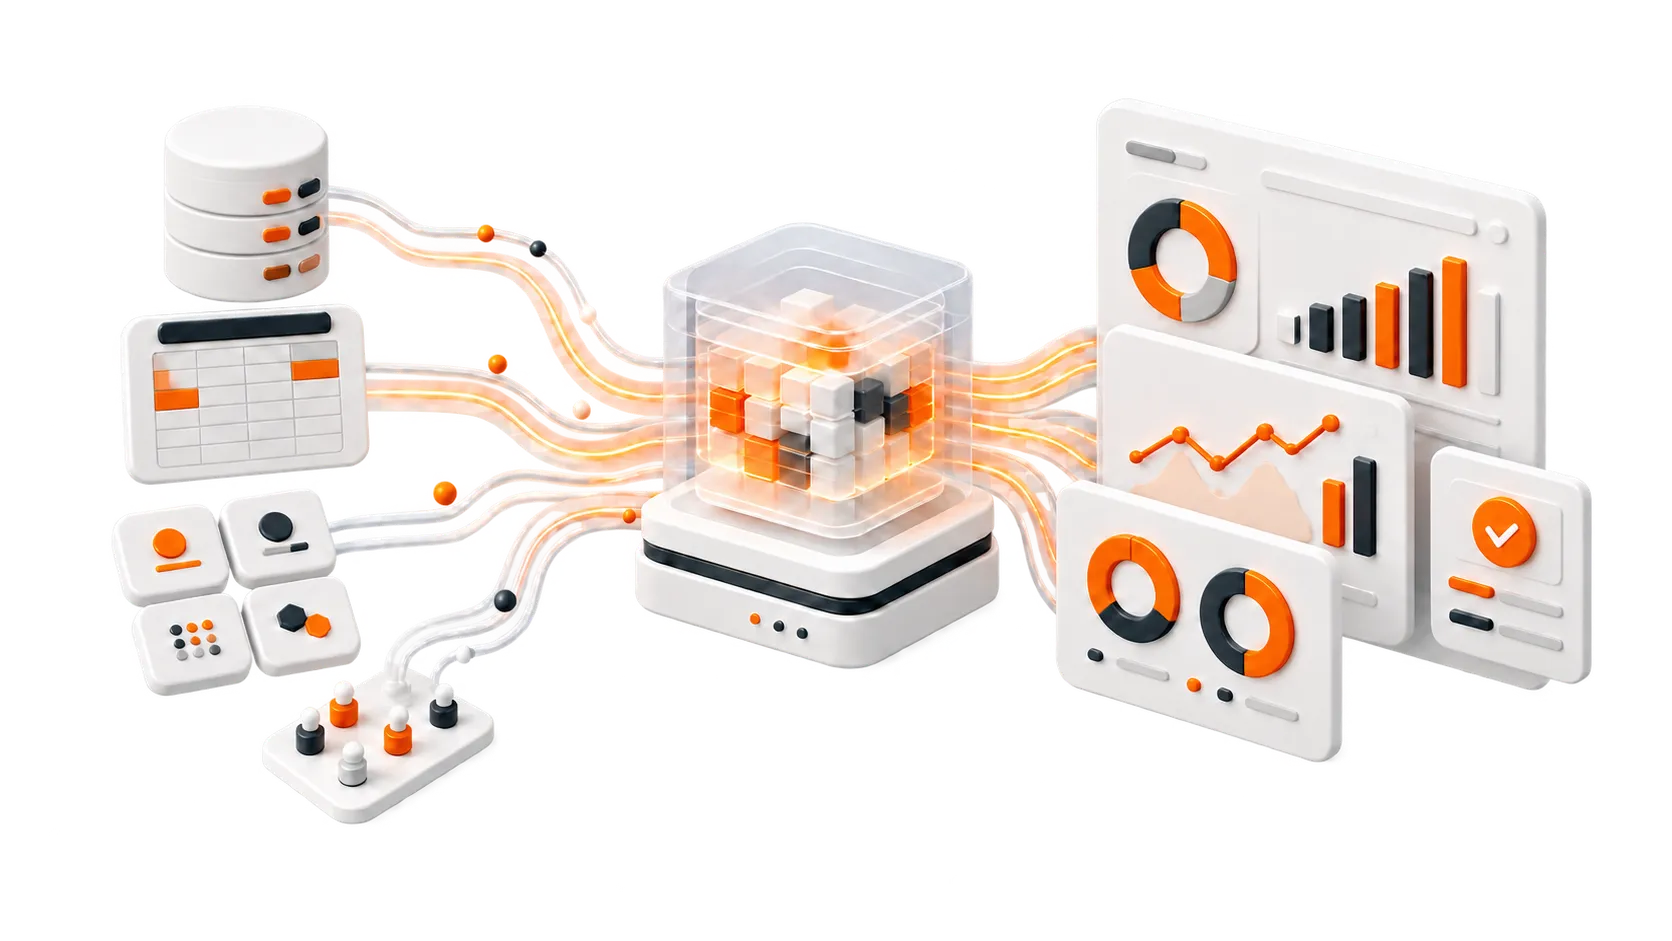
Connect, prepare, model, and visualize data across your business so your team can trust its reporting, understand performance, and act with confidence.
Power BI, SSRS, Tableau, SQL Server, MySQL, MongoDB, Oracle, PostgreSQL, and more.
OUR DATA ANALYTICS SERVICES
The expertise and systems you need to make data useful
Get support across the complete analytics lifecycle—from planning and data preparation to dashboards, performance optimization, governance, and team enablement.
STRATEGY
Analytics planning and solution design
Define the reporting requirements, business questions, and technical approach before development begins.
- Reporting and dashboard requirements
- KPI and metric definition
- Analytics roadmap
- Solution architecture
DATA PREPARATION
Data integration and preparation
Connect information from multiple systems and transform raw data into an analysis-ready structure.
- Data cleanup and transformation
- SQL and database preparation
- Excel and operational data consolidation
REPORTING
Custom dashboards and reports
Build practical reporting experiences that make performance easier to understand and monitor.
- Power BI dashboards
- Tableau and SSRS reporting
- Executive and operational reports
- Recurring management reporting
DATA MODELING
Advanced analytics and data modeling
Create dependable data models that reveal relationships, trends, and opportunities across the business.
- Dimensional data models
- Trend and variance analysis
- Forecasting support
- Scenario and performance analysis
OPTIMIZATION
Performance tuning and optimization
Improve slow dashboards, inefficient queries, and data models that struggle with growing datasets.
- Dashboard performance review
- SQL query optimization
- DAX and model optimization
- Report-load improvement
ENABLEMENT
Governance, support, and training
Maintain reliable reporting and help your team use analytics tools with greater confidence.
- Data definitions and governance
- Documentation and maintenance
- Analytics support
- Customized team training
FROM DATA TO DECISIONS
A dashboard is only useful when the data behind it can be trusted
Scalingwise helps connect data across systems, standardize important definitions, and create a reporting process your team can use consistently.
How it works
A clear process from business questions to usable reporting
We begin with the decisions you need to make, then design the data, reporting, and support required to answer them.
1
Plan and design
We review your business questions, existing reports, data sources, users, and technical environment.
2
Build and deploy
We connect and prepare the data, develop the model, and deliver dashboards or reports for validation.
3
Support and enable
We document the solution, improve performance, support ongoing reporting, and train the people who will use it.
WHY SCALINGWISE
Analytics support built around your business
Scalingwise combines data, reporting, finance, and operational experience to create analytics solutions that support real business decisions—not dashboards created only for presentation.
What you can expect
- Solutions tailored to your business goals
- Power BI and Microsoft platform experience
- Support across multiple databases and data sources
- Clear documentation and data definitions
- Performance-focused development
- Training and collaboration with your internal team
What clients say
Trusted support for teams that need the details handled
They were timely, professional, and accurate. We highly recommend the team!

Jeff Wheatley
Urban Oil and Gas Group – CFO
Working with Scalingwise has been a game-changer. Their reporting is clear and timely, and their team is always available when we need them.

John Hansen
Meydenbauer Group – CEO
They’ve helped us keep track of every detail, which has made managing payroll and invoicing seamless.

Yasmin Ali
Skillspire – Founder
Frequently asked questions
Everything you need to know to get started.
Reports become inconsistent when data sources are not standardized, when files are edited manually, or when formulas reference outdated or incorrect cells. Creating a centralized data model ensures that every report is based on the same logic and definitions
Use a BI tool or automation platform that connects directly to your data sources. When the underlying data refreshes on a schedule, your dashboards update without manual intervention.
The easiest approach is to pull data from each system into a single integration layer or database. Once unified, dashboards and reports can be built on top of one consistent dataset.
Slow dashboards usually result from inefficient data models, excessive columns, poorly designed relationships, or using DirectQuery when Import mode would be faster. Optimizing the model can significantly improve speed.
A single source of truth is created by storing all metrics, business definitions, and reference tables in one central location. All dashboards and reports should pull data from this shared source to eliminate inconsistencies.
Automated reporting can be achieved using BI tools or workflow platforms that refresh data at set intervals and email or publish reports automatically.
Accurate data has consistent totals across systems, no duplicates, reliable categorization, and predictable trends. Automated validation checks can also help detect issues early.
Ready to make your data more useful?
Tell us what you are trying to understand
Whether you need consolidated reporting, a new dashboard, cleaner data, better performance, or help defining the right metrics, start with the business question you are trying to answer.
Share a few details and a Scalingwise consultant will follow up.